


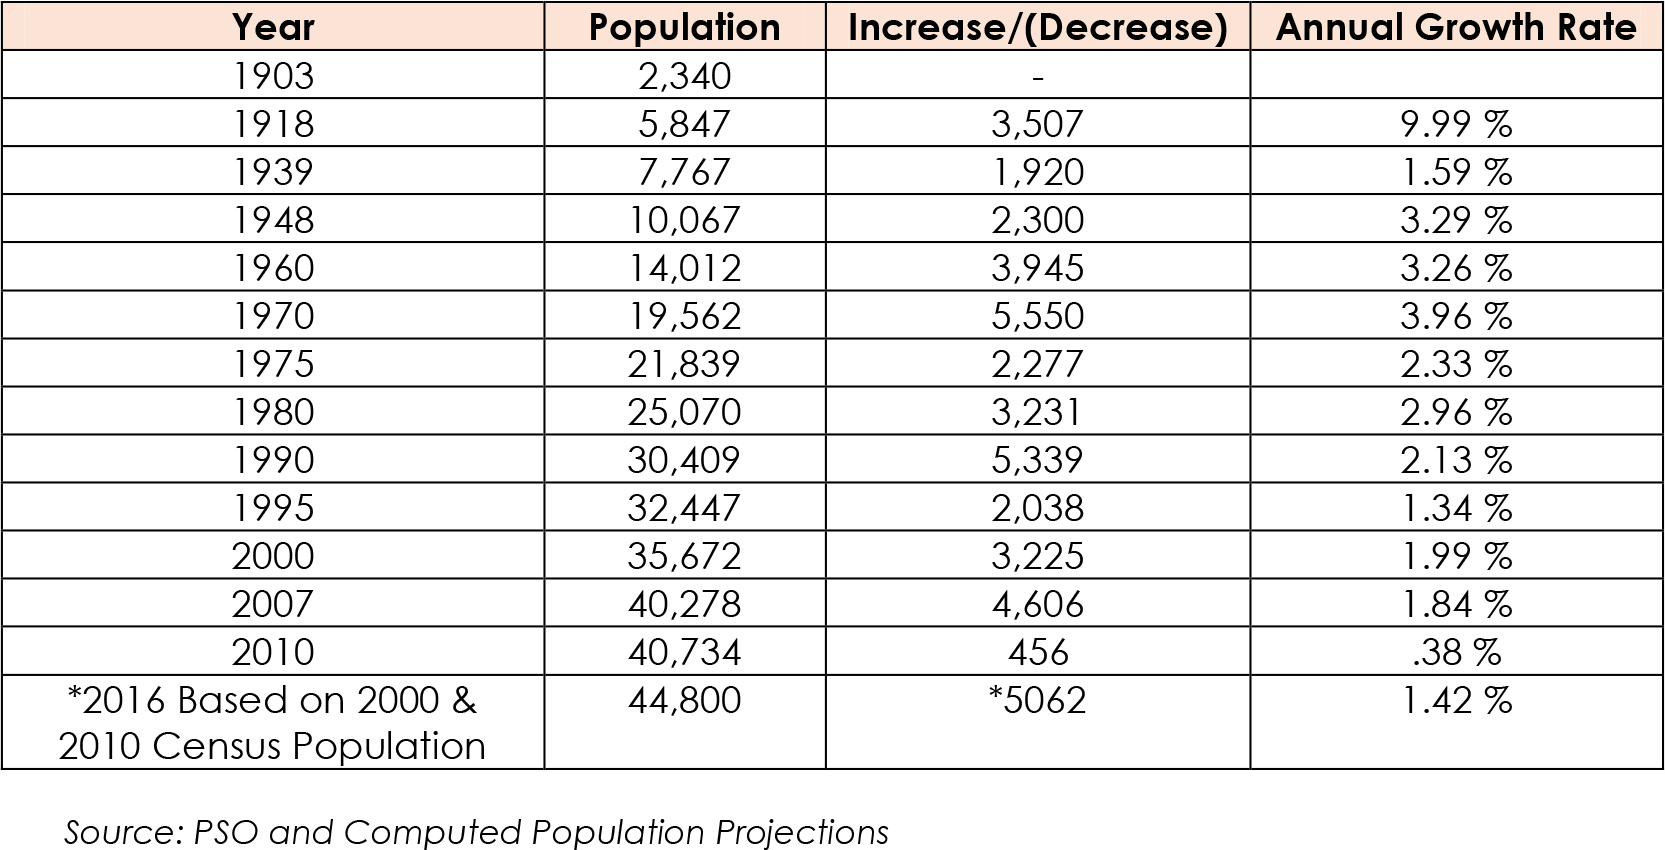
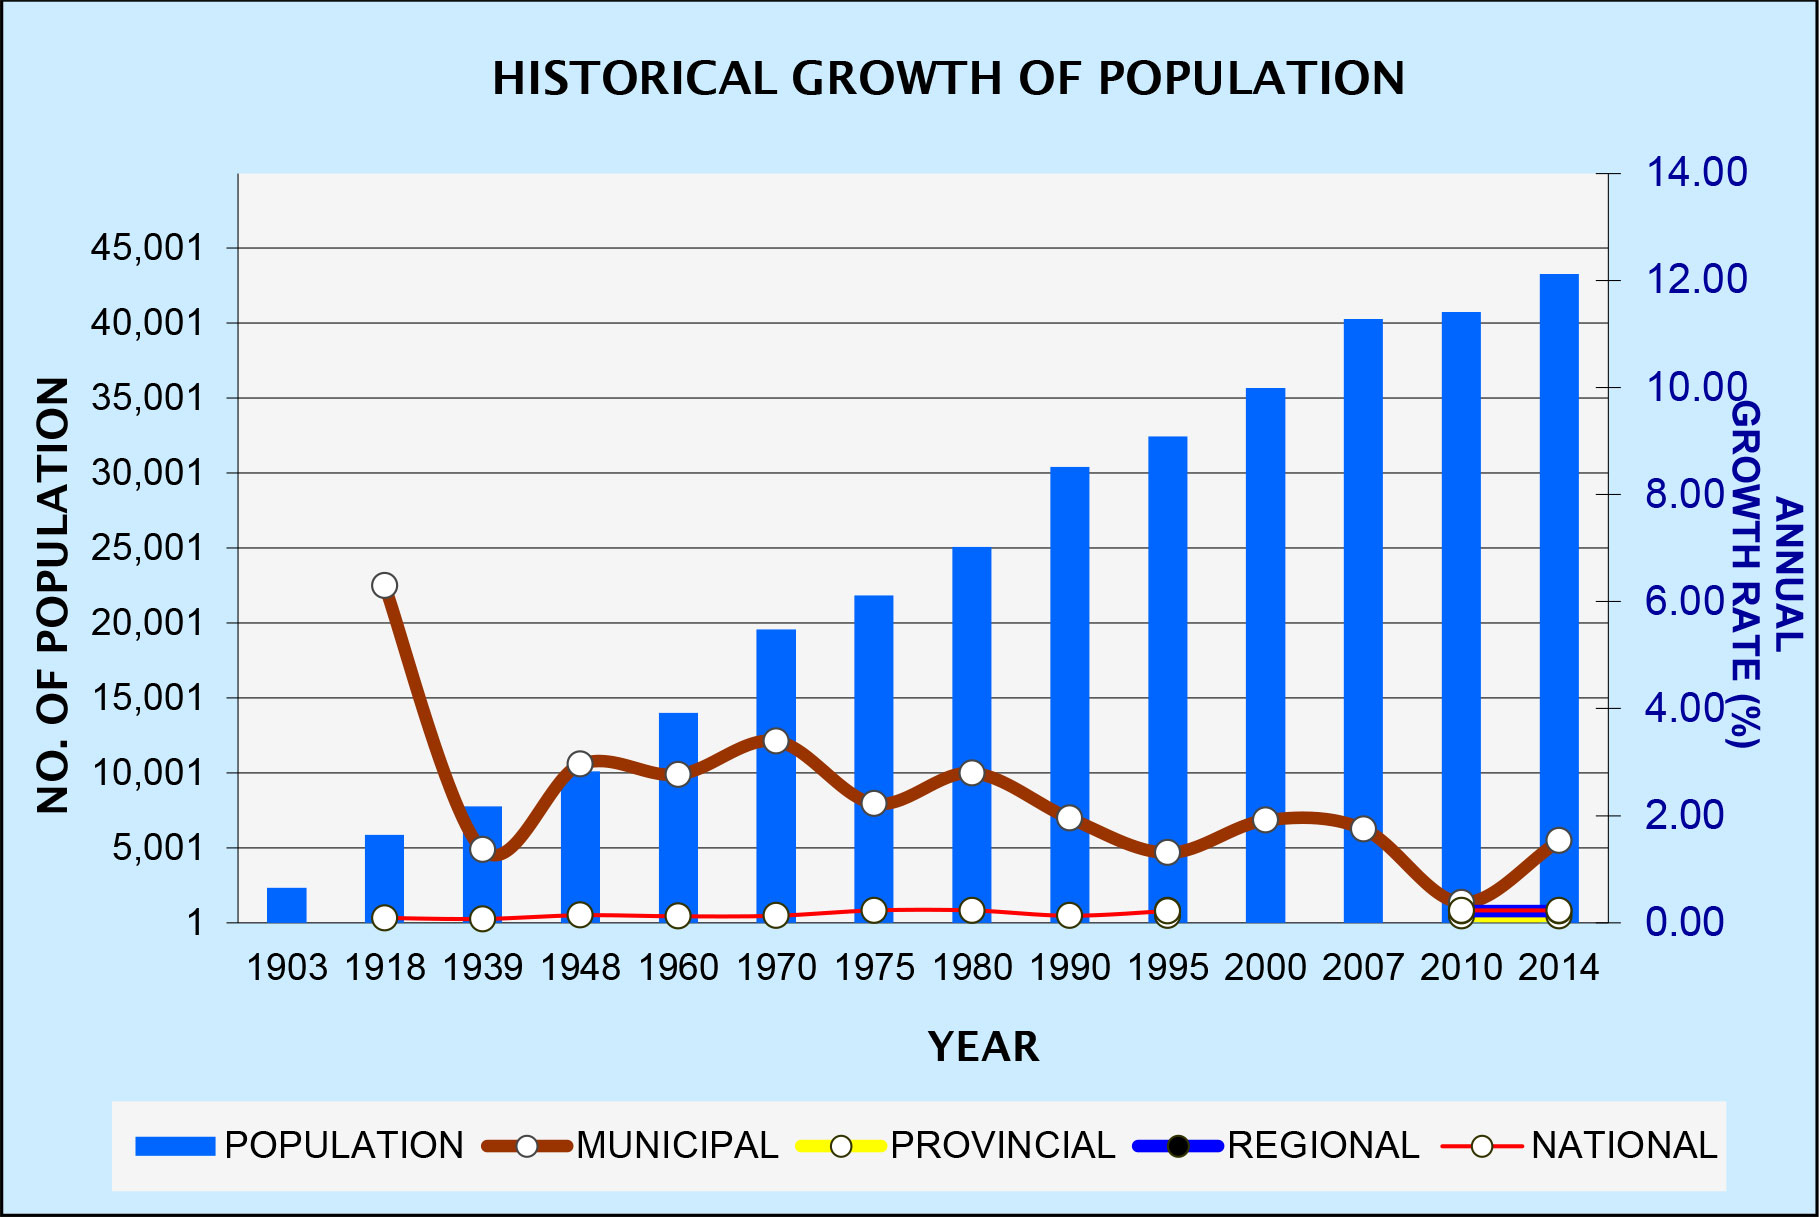
The first censal year in 1903 recorded a total population of 2,340. The next censal year, fifteen (15) years later, in 1918 the population recorded was 5,847 with an annual growth rate of 9.99 %. In 1939, there was an increase of 1,920 giving a total population of 7,767. By 1948, the total population rose to 10,097 with an average growth rate of 2.29 %. Twelve (12) years after 14,012 people resided in Tuy. In 1970, based on NSO there is an increase of 5,550 persons, making a total population of 19,562 with an average growth rate of 3.96 %. After 5 years, in 1975, total population became 21,839 with an average growth rate of 2.33%. Again, there is an increasing trend in population in 1980 where NSO registered an increase of 3,231 persons; thus, total population was 25,070. In 1990, with an average growth rate of 2.13 %, total population was 30,409. NSO recorded a total population of 32,447 in 1995; average growth rate was 1.34 %.
In 2000, the population is 35,672 with an average growth rate of 1.99 %. This growth rate was smaller than that of the province at 2.58 %. By 2010, population is 40,734 or an increase of 5,062 over 10 years. Using the derived growth rate of 1.43 %, between 2000 and 2010, projected population for the year 2016 is 44,800. The doubling time for Tuy is in 2059 when the population will be 85,720. The following table and graph show historical growth of population from 1903 – 2010 based on census data as gathered from the Philippines Statistics Office, (PSO) (formerly National Statistics Office, NSO) and the projected population for the current year, 2016 considering the 2000 and 2010 census data, which is the base year of the Comprehensive Development Plan.
In 2000, the population is 35,672 with an average growth rate of 1.99 %. This growth rate was smaller than that of the province at 2.58 %. By 2010, population is 40,734 or an increase of 5,062 over 10 years. Using the derived growth rate of 1.43 %, between 2000 and 2010, projected population for the year 2016 is 44,800. The doubling time for Tuy is in 2059 when the population will be 85,720. The following table and graph show historical growth of population from 1903 – 2010 based on census data as gathered from the Philippines Statistics Office, (PSO) (formerly National Statistics Office, NSO) and the projected population for the current year, 2016 considering the 2000 and 2010 census data, which is the base year of the Comprehensive Development Plan.
Historical Growth of Population, 1903-2010 and Projected Population, 2016
Population Distribution
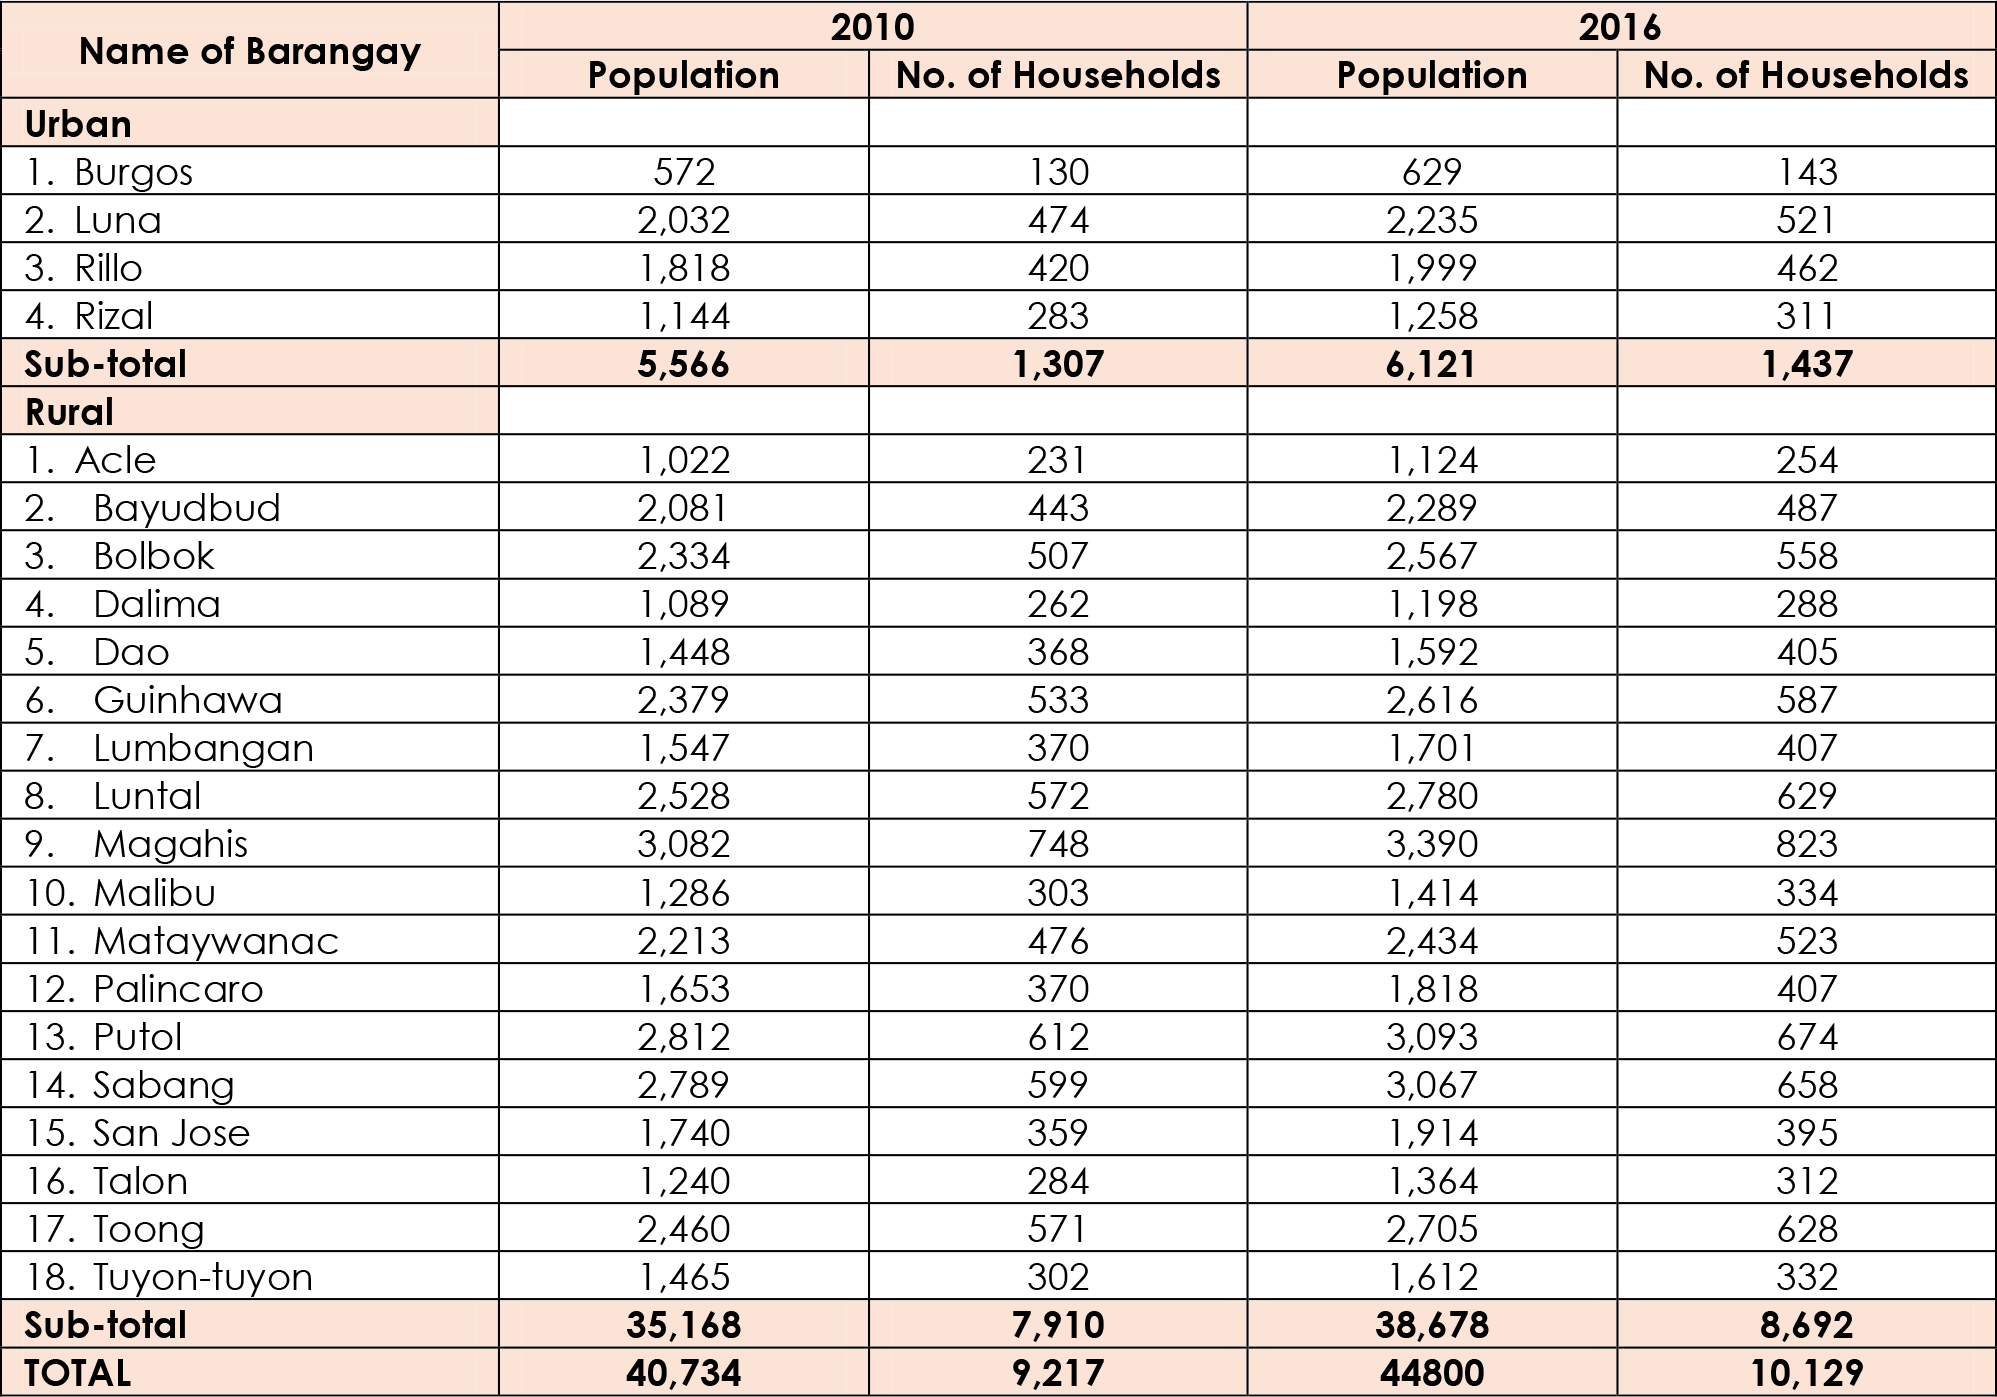
The municipality has a total population of 40,734 as of 2010 PSO report. Of these population 5,566 or or about 14 % reside in the four (4) urban barangays of the municipality. The remaining population of 35,168 or 86 % of the total population constitute the rural population. With the current population of 44,800, urban population is 6,272 and rural population is 38,528.There are 9,217 households as of 2010 census population with total average household member of 4.42. Total number of households for the municipality and average household members by barangay is also given. For the current year, total households are 10,129.
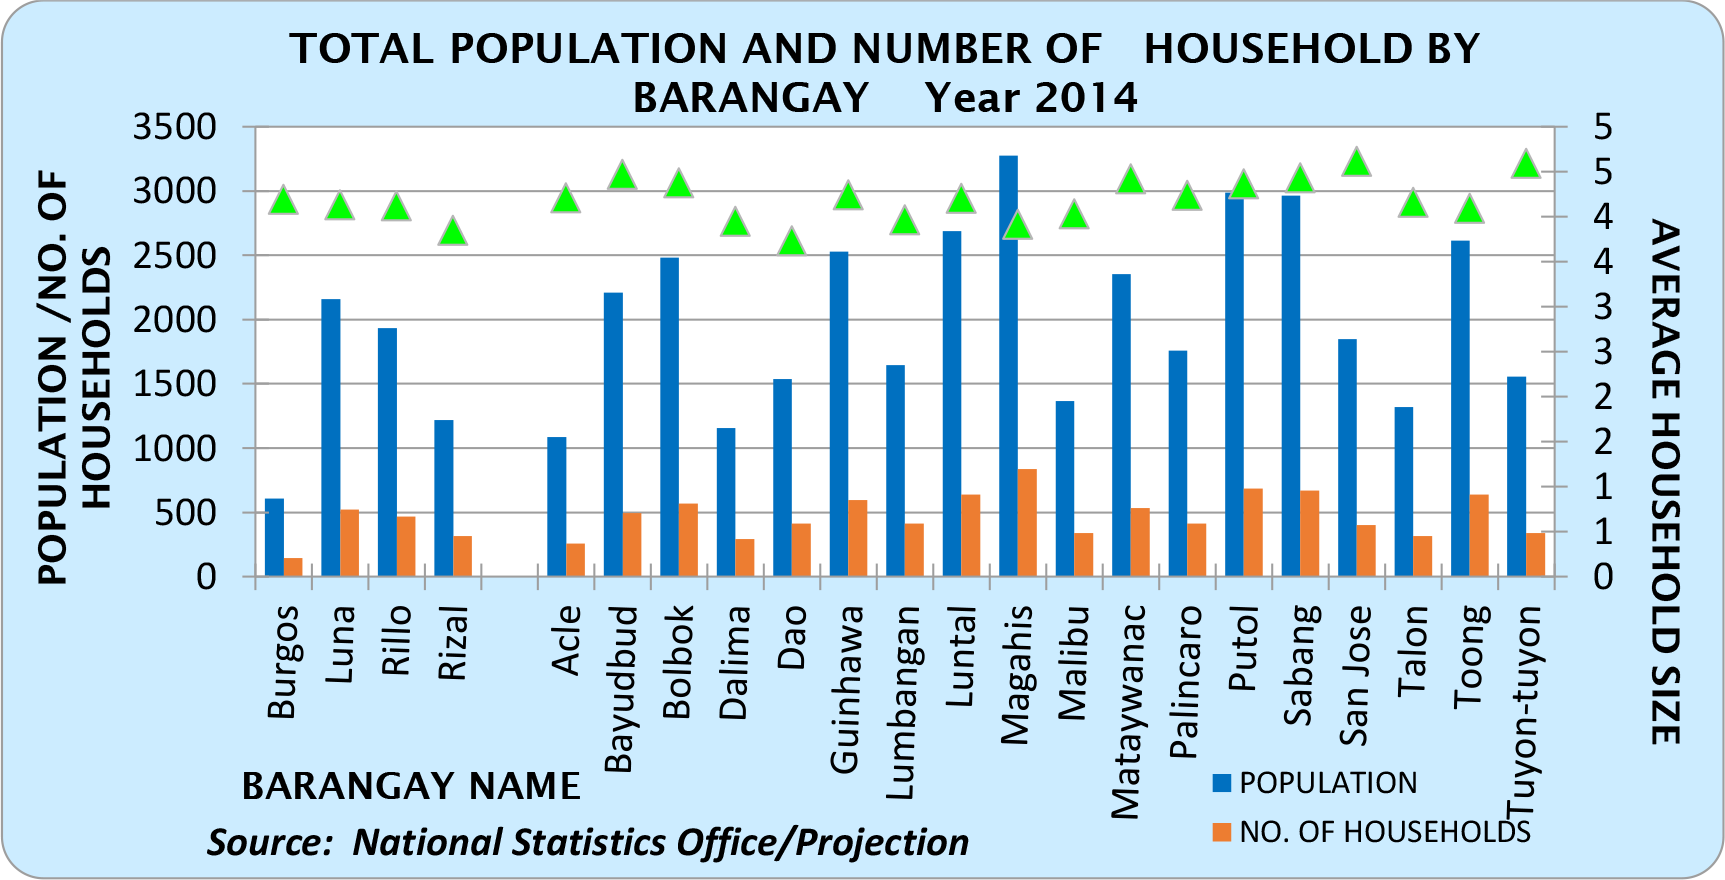
The thickly populated rural barangays are Magahis, Luntal, Putol, Sabang and Toong. Some of these barangays are near the Poblacion areas and accesses to their barangays are along the national road. Barangays Magahis and Toong are among the biggest barangays in terms of land area. Barangays with the least population are Talon, Malibu, Dalima, Acle and Burgos. The following table and graph show population by barangay and number of households in 2010 based on PSO data and 2016 as computed.
Population and Number of Households
By Barangay, 2010 & 2016
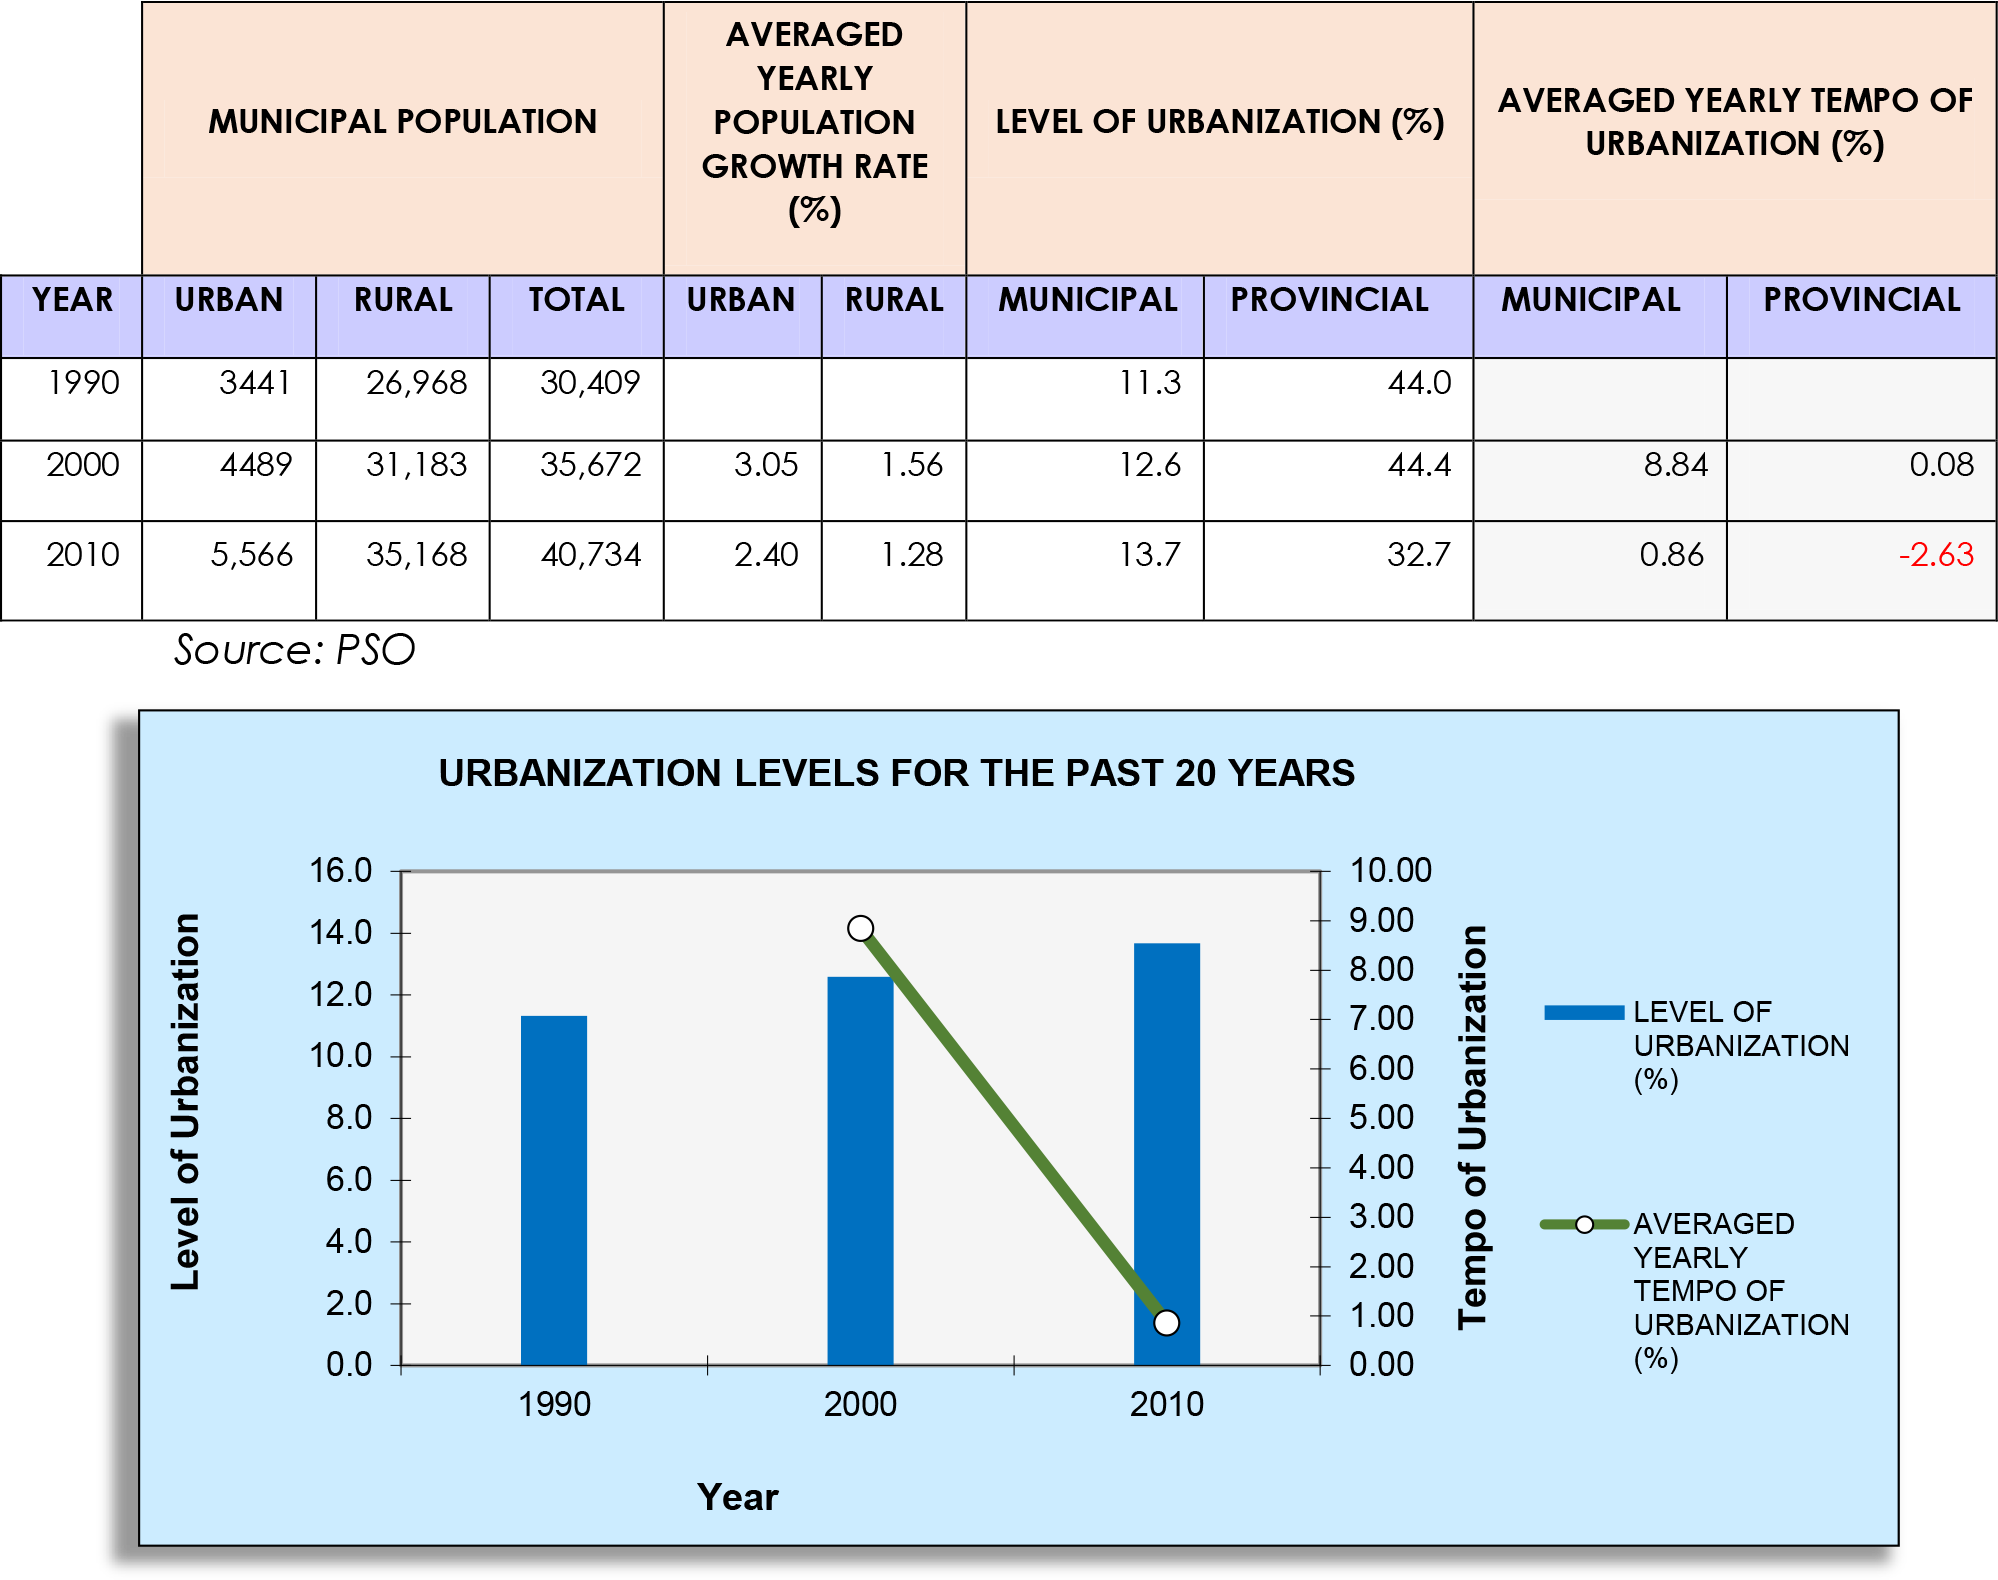
Urbanization Level
Urbanization is defined as growth in the proportion of a population living in urban areas when there is development. It has also been established that when there are economic opportunities in an area where in–migration occurs, this results in increasing density of population. Urban population which is 6,122 residing in the urban barangays located in the Poblacion constitutes 14 % of the total population in 2016. Thus, urbanization level is 14 %. This shows that the municipality is still rural. It is lower compared to the urbanization level of the Province of Batangas at 32.67%. This still is attributable to the functional role of the LGU which is still agricultural. The following table and graph show urbanization levels for the past 20 yearsUrbanization Levels For The Past 20 years
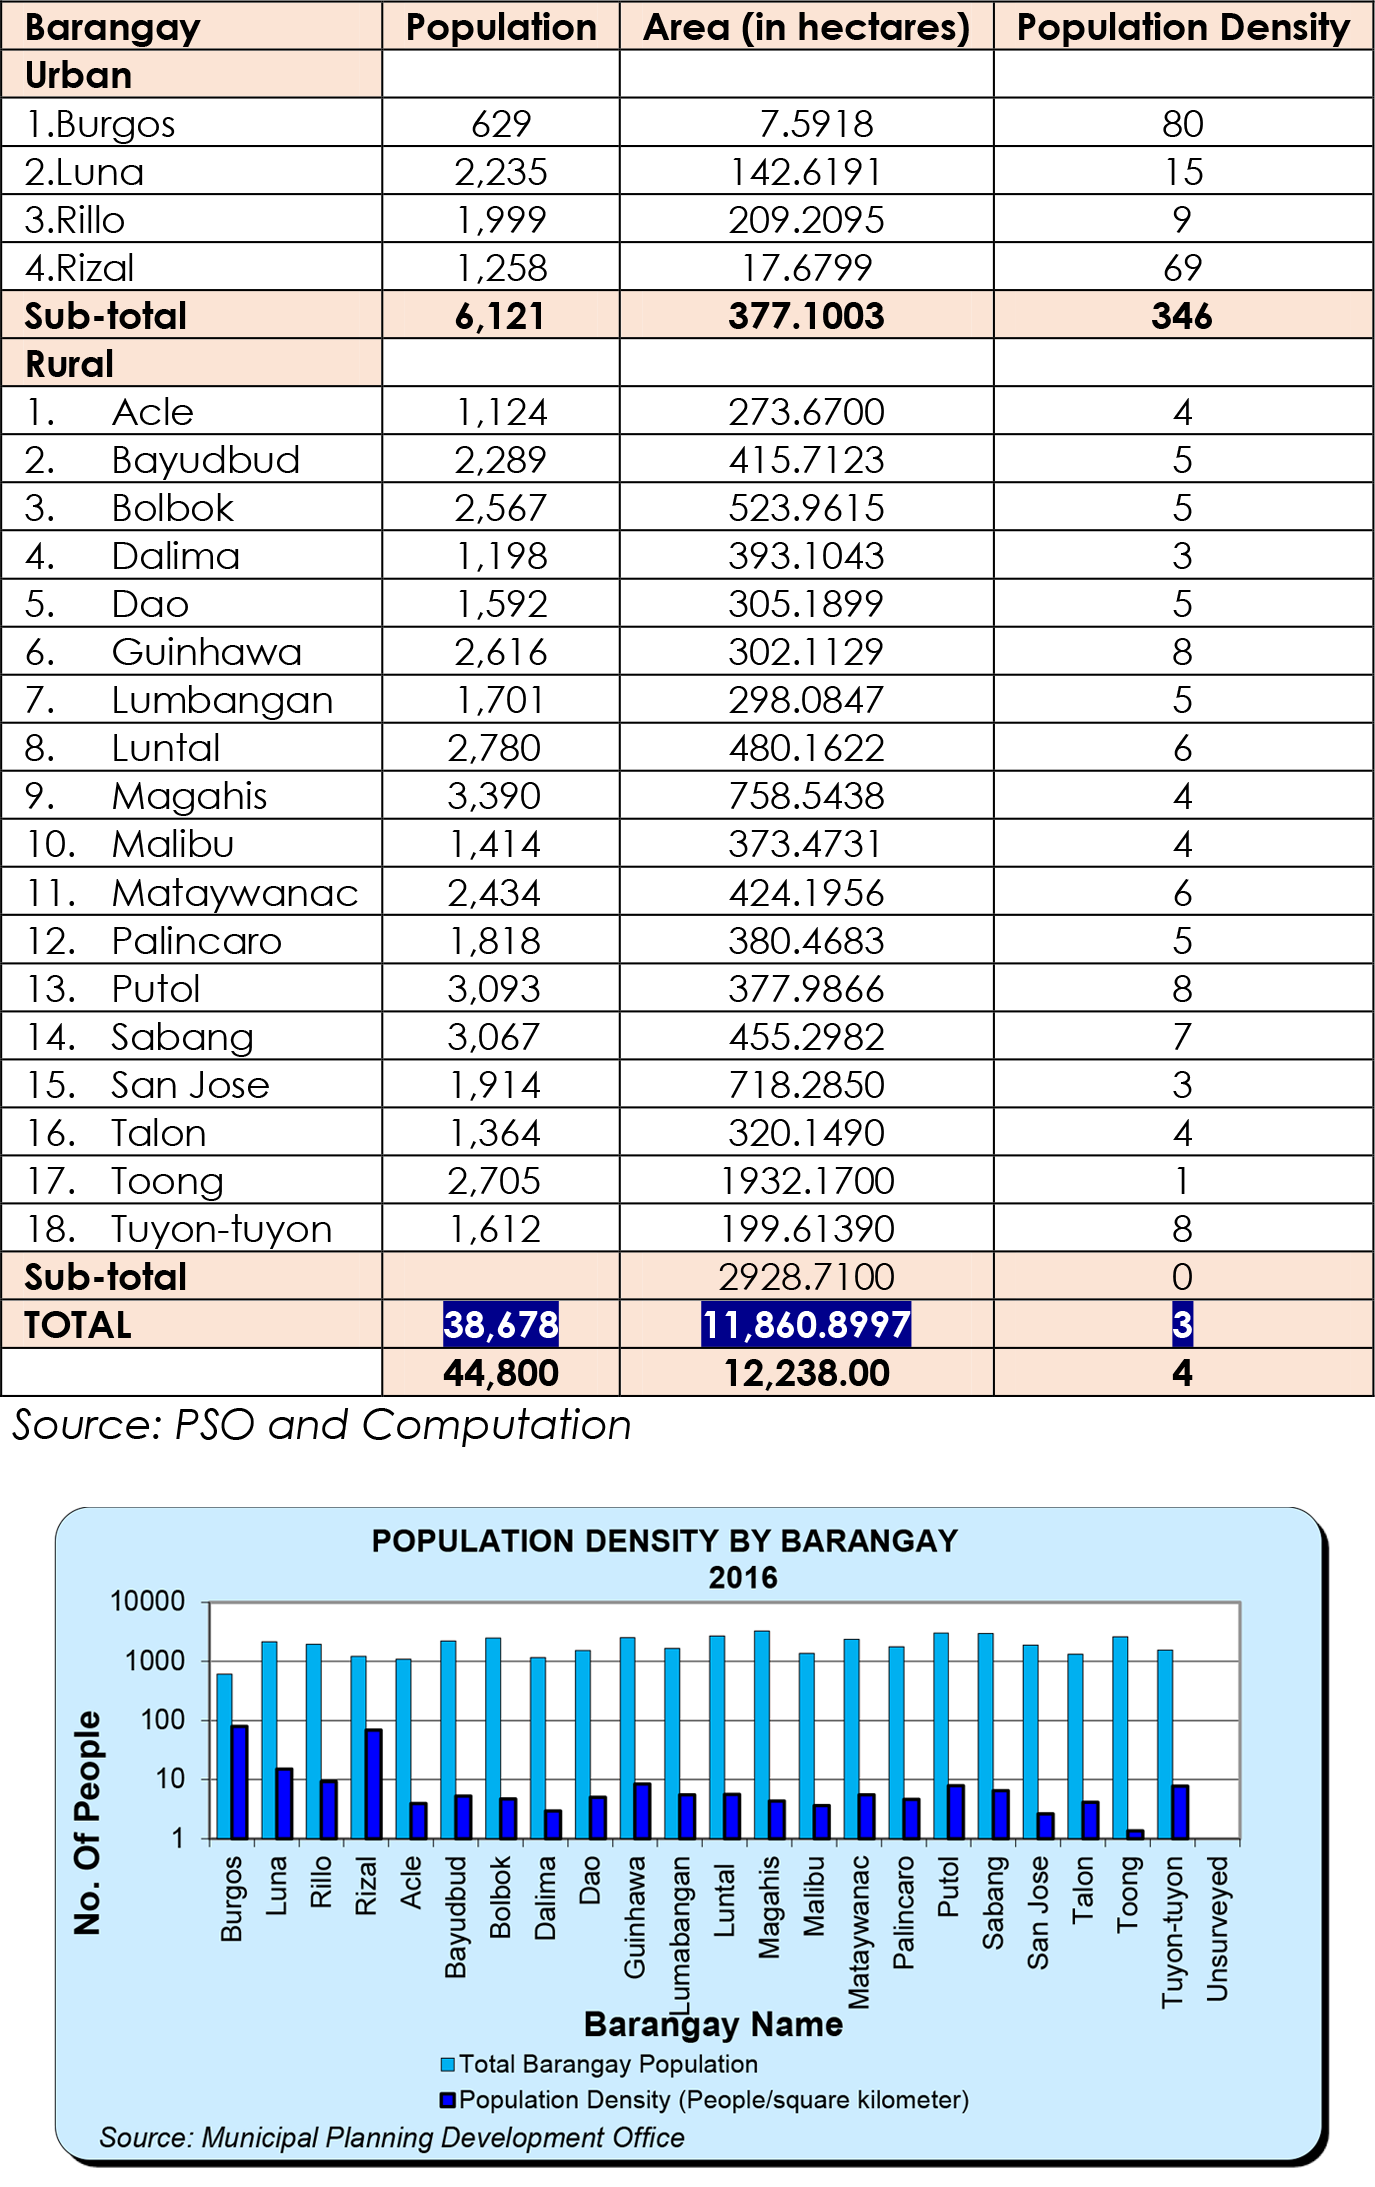
Population Density
The gross density in Tuy is four (4) persons per hectare while the urban density is 16 persons per hectare which is higher than the gross density. The urban area totals to 377.1003 hectares. With an urban population of 6,122 the urban density is 16 persons per hectare. There are 38,678 individuals living in the rural barangays that cover a total land area of 11,860.8997 hectares. Given the these figures, rural density is 3 persons per hectare. Since the municipality is predominantly rural, most residents are still engaged in agricultural activities. The following table shows population density by barangay.Population Density By Barangay
Population Composition
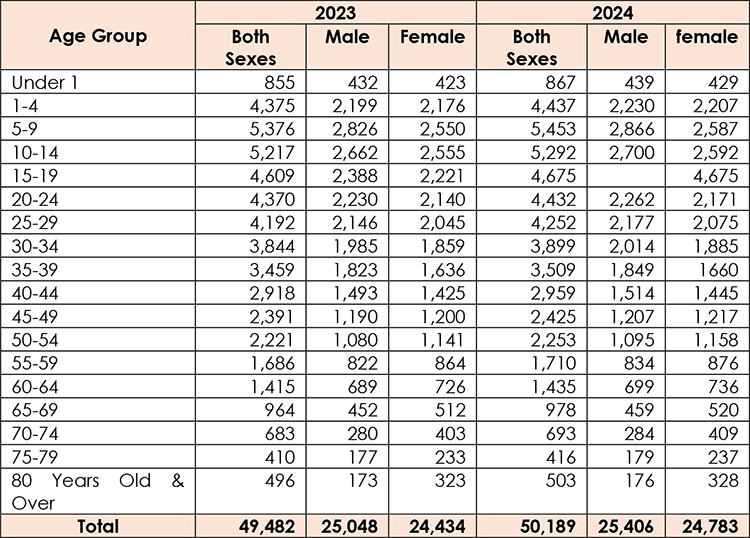
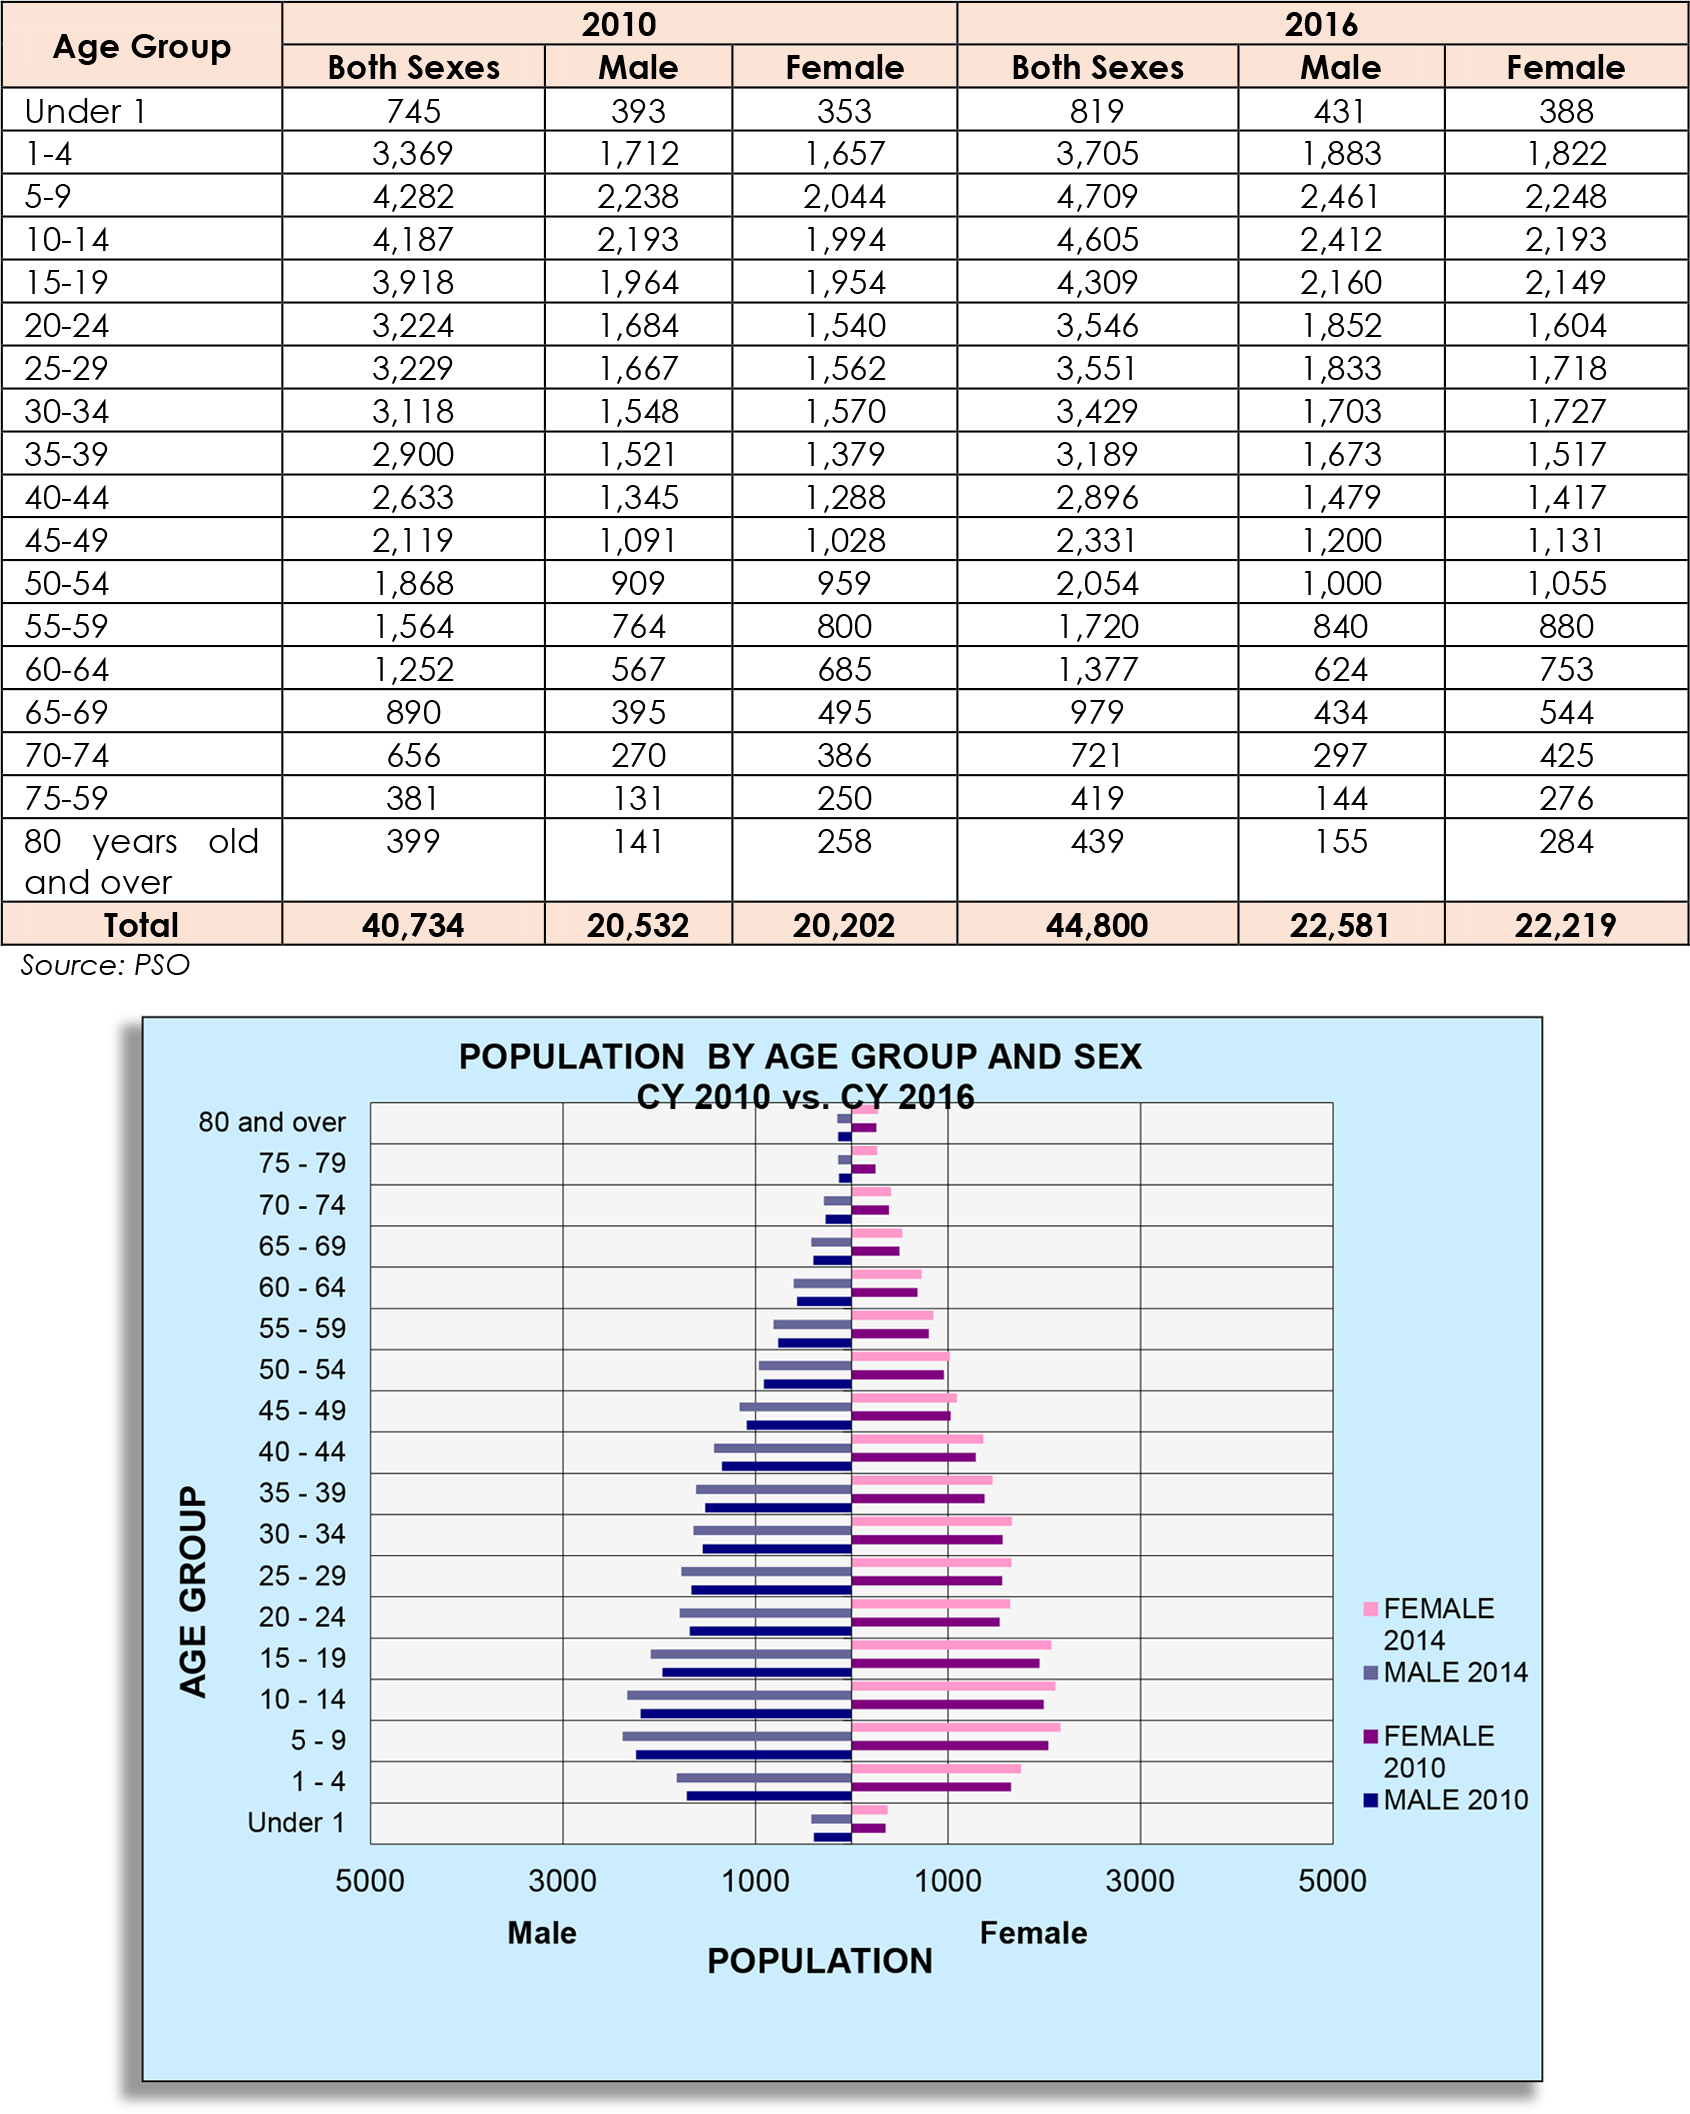
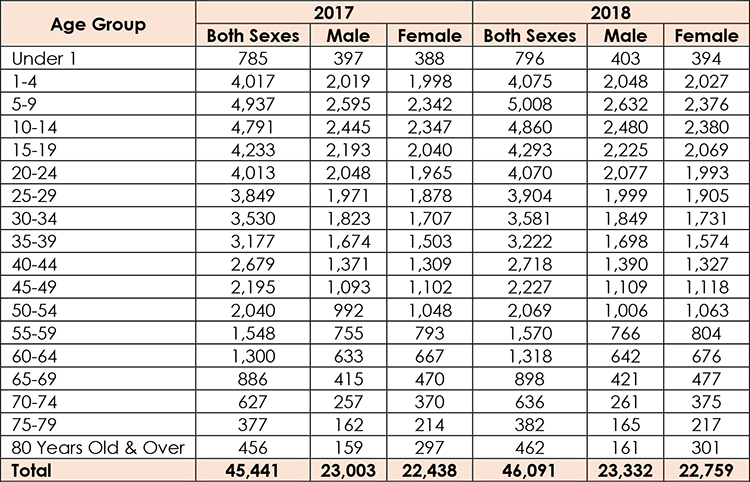
The age and sex structure of the population is one of the basic inputs in development planning activities. It determines a number of planning concerns; particularly those dealing with the population in the school ages, working-age, dependent-age group and sex.The total population of 44,800 is composed of 22,581male population which is about 50.40 % of the total, and 22,219 females or 49.60 % of the total. Sex ratio is 1.02, which shows that males is slightly more than the female population. The following table and graph show population by age group and sex for the period 2010 and 2016.
Population By Age Group, By Sex, 2010 and 2016
The following table and graph show population composition: school-age population, productive or working age population, labor force, dependency ratio and other population composition.
Population Composition: School-Age Population, Working Age
Population, Labor Force, Dependent Population, Dependency Ratio and Other Population Composition
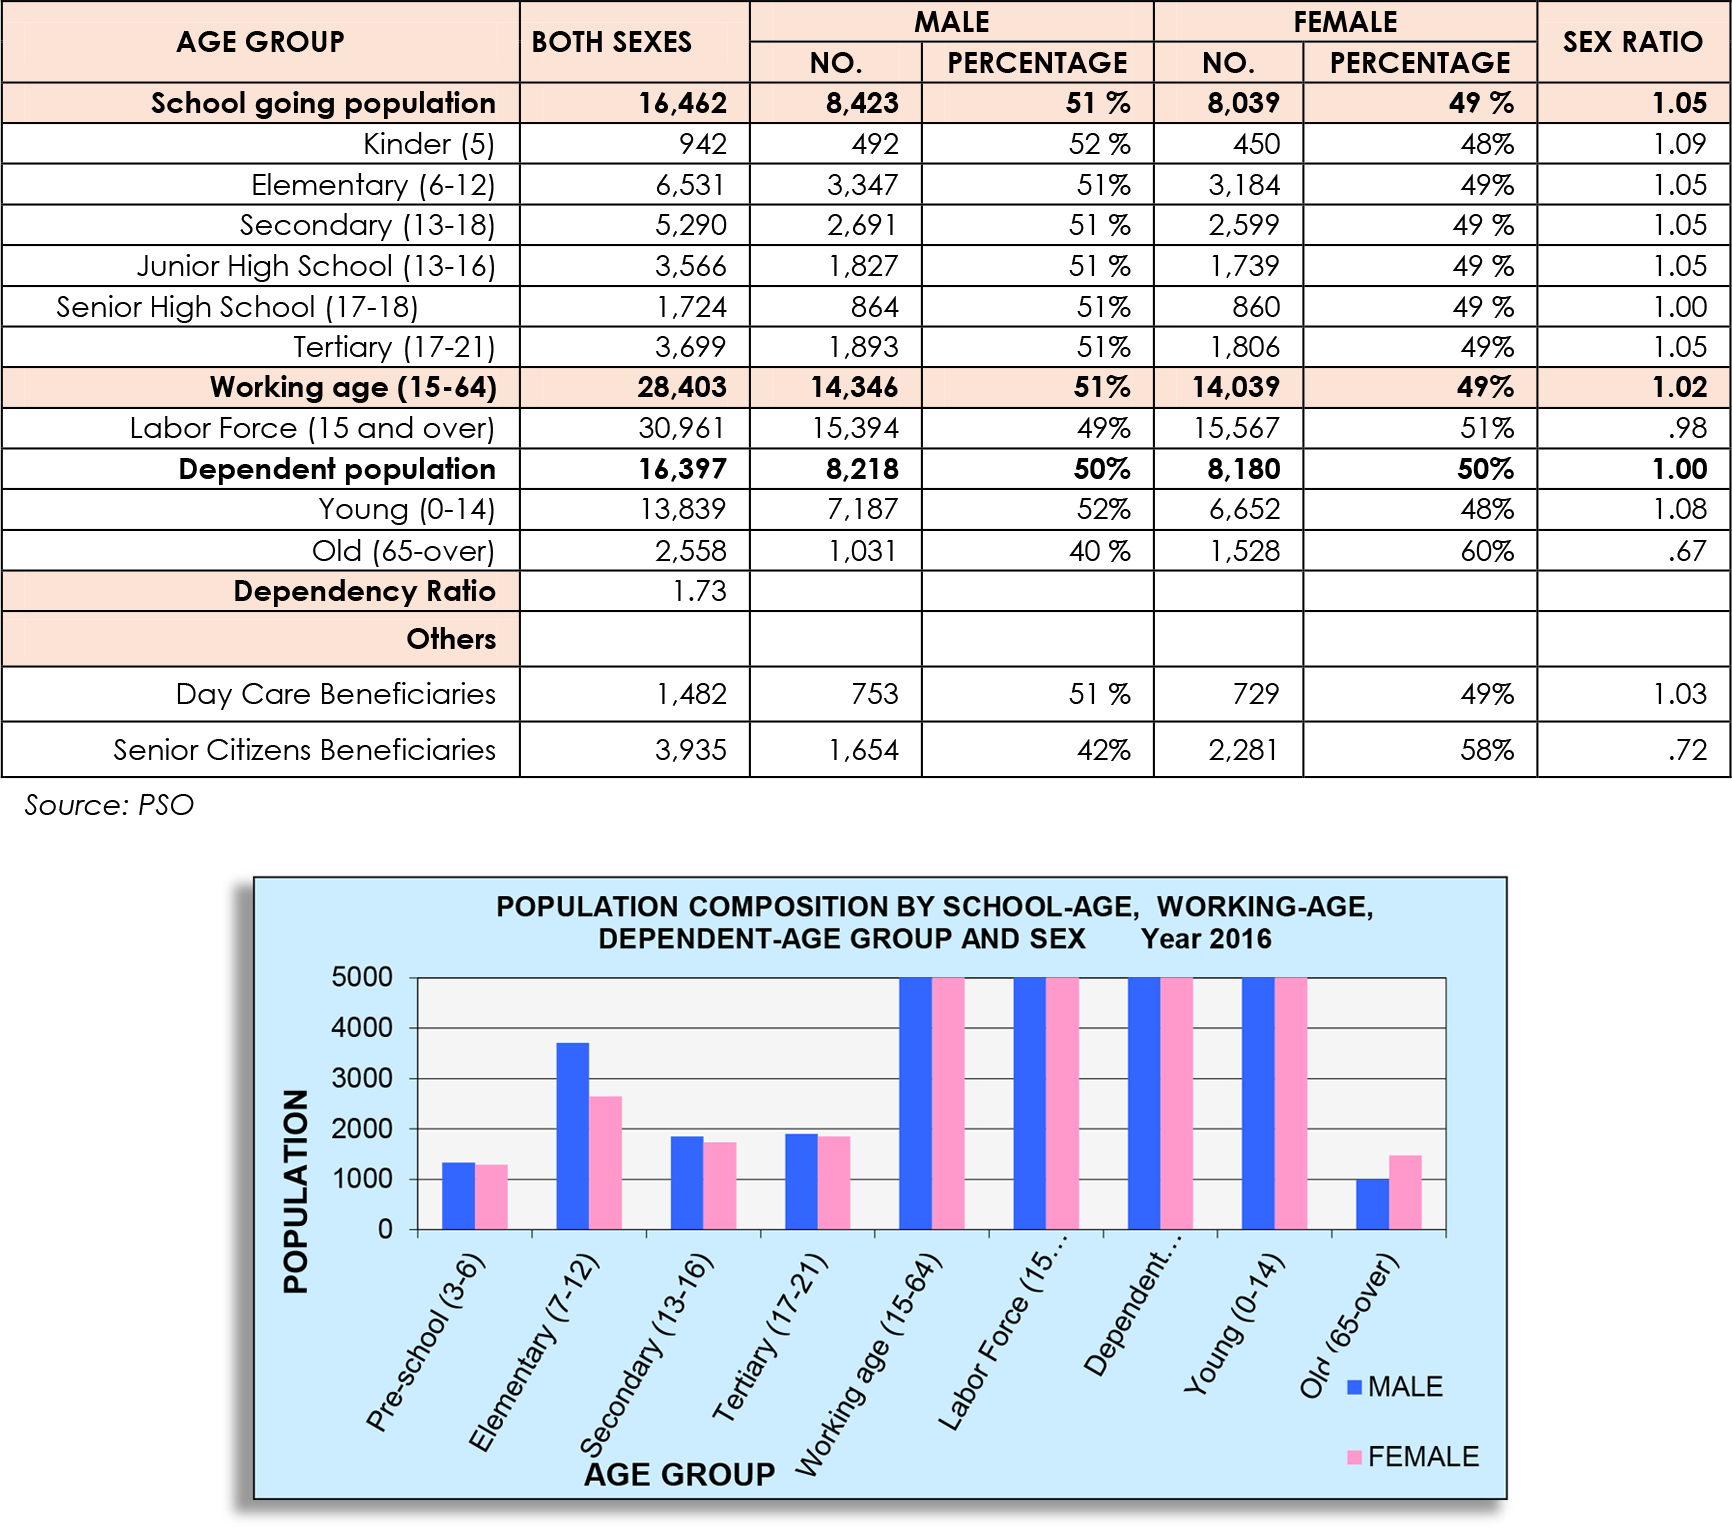
Total school age population for 2016 totals to 16,462. Of this, number, 942 or 6 % are aged five (5) years old; 6,531 or 40 % are aged 6-12 years old; 5,290 or 32 % are aged 13-18 and 3,699 or 12 % are aged 19-23 years old. This breakdown in ages of the population correspond to the four (4) educational levels such as kinder for 5 years old; elementary for ages 6-16 years old; secondary for ages 13-18 which further sub-group into Junior High School for ages 13-16 and Senior High School for ages 17-18 years old. Population ages 19-23 years old intended for tertiary level of education. Of this population males are 8,423 or 51 % and females are 2,281 or 49 %. Sex ratio among the school-age population is 1.05 showing that there are more males than females in the age group.
The productive or working age population aged 15- 64 years old is 28,403or 63.40 % of the total population. Males of working ages constitute 51 % of the total working population while females are 49 %. Labor force population aged 15 years old and over is 30,961 or 69.11% of the total. Males component of the labor force constitute 49 % while females are 51 %.There are more males among the working ages 15-64 years old and there are more females among the labor force ages 15 years old and over.
The dependent population are persons who are below 15 and over 64 years old. The child and youth group are those belonging to the age group 0-14 years old which total to 13,839 or 31 % while the old population aged 65 years old and over is 2,558 or 6 %. The total dependent population then is 16,397 persons or 37 % of the total population. Dependency ratio is 1.73. This shows that the population is a provider population with 1.73 productive or working population supporting one (1) dependent. Provision of work or job opportunities must be one of the economic strategies to be included in this plan to realize the full potential of the productive or working ages population or the labor force.
Other population composition considered, are the target clienteles of the Municipal Social Welfare Development Office (MSWDO) in terms of Day Care Program and Senior Citizens Program. Day Care beneficiaries, children aged 3-4 years old total to 1,482 children or 3 % of the total population. Elderlies or Senior Citizens Program beneficiaries total to 3,935 or 9 % of the total population. There are more males among the day care beneficiaries at 51 % while females constitute 49 %. On the other hand, there are more female senior citizens at 58 % while males are 42 %.
Other Population Characteristics
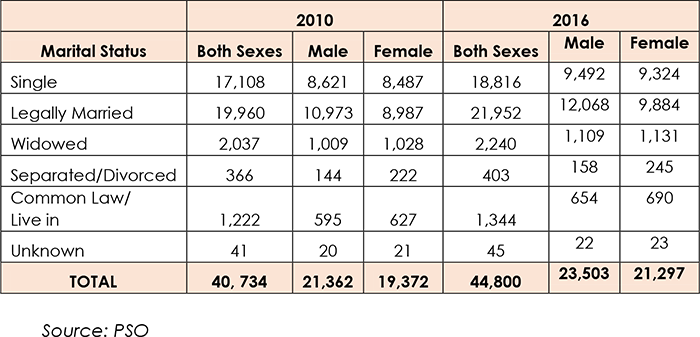
1. Marital Status
The population ten (10) years old and over totals to 35,566 of which males are 17,806 or 50.01 % and female are 49.99 %. Of this number, marital status of the population consist of the following: 42 % are single; 49 % are married; 5 % are widowed; .9 % are separated/divorced; 3 % are common-law/live-in and .1 % are unknown. The following table shows population by marital status, 2010 and 2016.Marital Status of the Population, 2010 and 2016
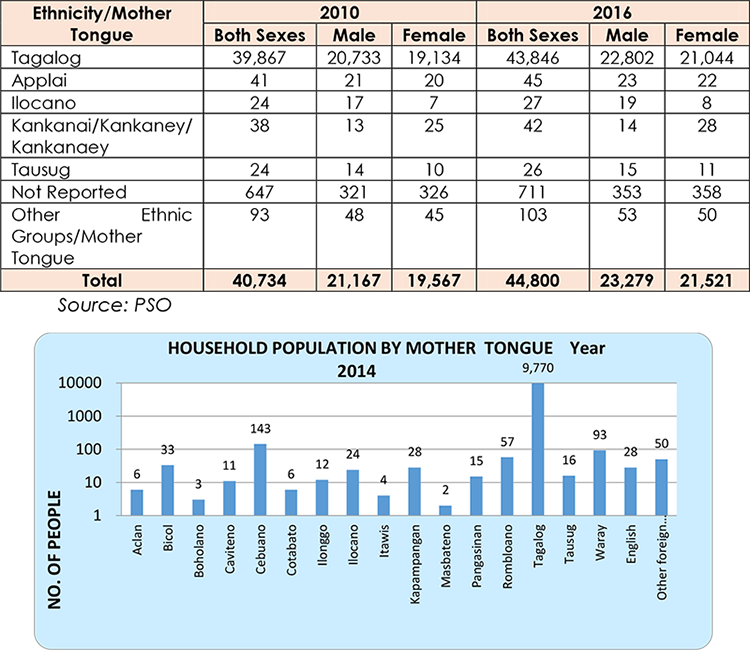
2. Ethnicity/Mother Tongue
Majority of the population or about 94.84%, speak Tagalog. This is the dialect predominantly spoken because Tuy is in the Southern Tagalog region. A few residents speak Cebuano representing about 1.39% of the population. The remainder percentages speak the other local dialects of the country. The following table and graph show population by mother tongue/ethnic origin.Population By Ethnic Origin/Mother Tongue, 2010 And 2016
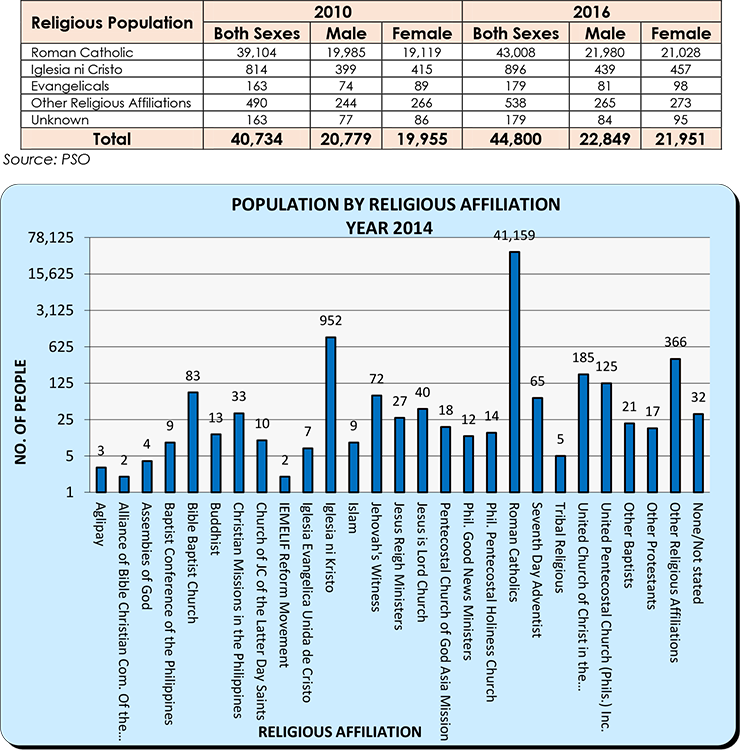
3. Religious Affiliation
The residents of Tuy are predominantly Roman Catholics. They constitute about 96 % of the total population. Other religious affiliations with most members are Iglesia ni Cristo, 2 % and Evangelicals, .4 % of the total population. Other religious affiliations include United Church of Christ in the Philippines, United Methodist Church, Other Protestants, Jehovah’s Witness, Philippine Benevolent Missionaries Association (PBMA), Seventh Day Adventist, Baptists and other smaller groups. These constitute about 1.2 % of te total population. Still others, about 2.8 % have unknown religious affiliation. There are more males with religious affiliation than males. The following table and graph show religious affiliation of the population for the years 2010 and 2016.Population By Religious Affiliation
4. Literacy Rate
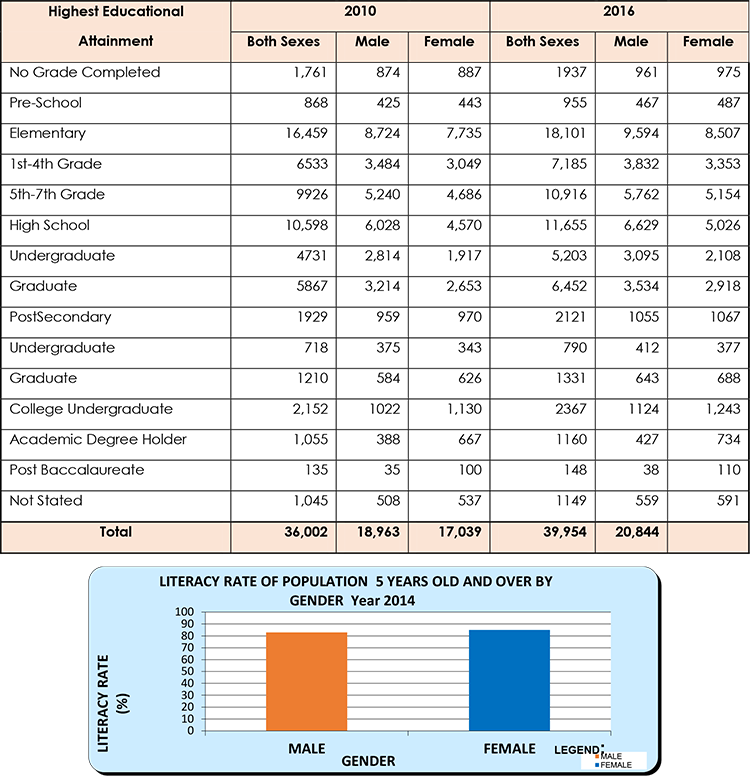
Literacy rate is 92 % of the population aged five (5) years old and over of the total population. Population with no grade completed and those whose educational attainment is not stated constitute 8 % of the population group.Highest educational attainment is baccalaureate courses which post graduate studies, masteral degrees or doctorates. Only about 4 % of the population are academic degree holders constitute about 3 % of the population group. Most of the population are elementary graduates who had completed 5th-7th grade constituting 27 % of the population group. There are undergraduates in all levels of studies from elementary, high school and college levels. The following table and graph show population five (5) years old and over with highest educational attainment.
Population 5 Years Old and Over By Highest Educational Attainment
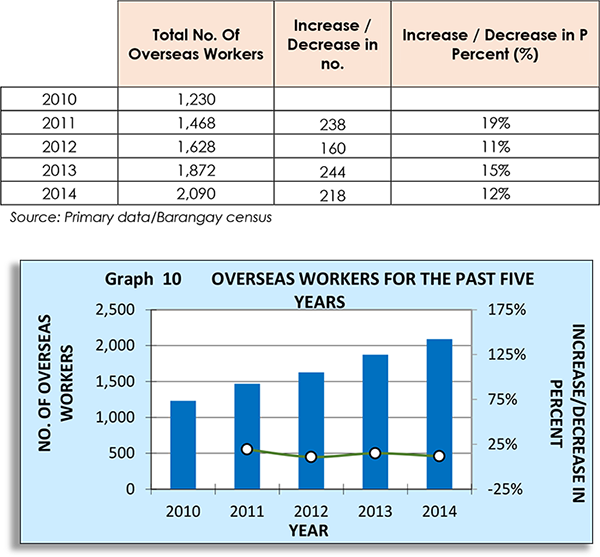
Overseas Filipino Workers
Also known as OFWs, these are Filipinos working abroad who are expected to return permanently either upon the expiration of a work contract or upon retirement. Balikbayans are Filipinos who have become citizens of another country and return to the Philippines for temporary visits. Overseas Filipino Investors or OFI are those Filipino expatriates who contribute to the economy through remittances, buying properties and creating businesses.Overseas Workers For The Past Five Years
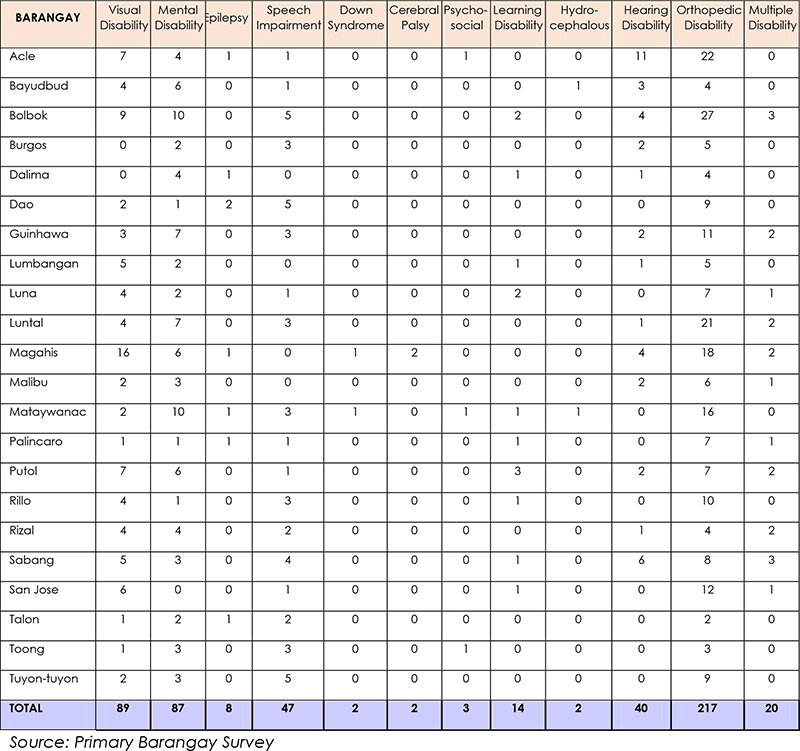
Disabled Persons
Disability as defined by NSO refers to any restriction or lack of ability to perform an activity in the manner or within the range considered normal for a human being.The municipality has a total of 519 disabled persons. There are 89 visually impaired persons, 87 persons with mental disability, 47 downsyndrome and 217 orthopaedic-impaired persons in Tuy. The following table shows number of persons with dsabilities per barangay.No. of Persons With Disabilities
Population Projections and Estimates
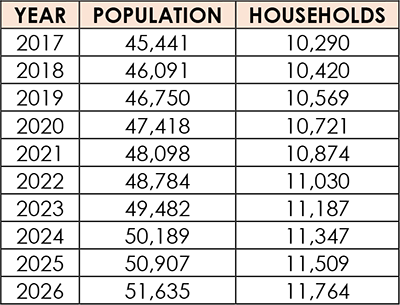
Population projections area basic requirements in planning and are primarily used as bases for estimating future needs for basic services (e.g. education and health services, determining level of demand for facilities and utilities, economic-related needs and corresponding spatial requirements, among others.The geometric rate or the mathematical method was used in determining growth rate from the period 2000 TO 2010. The derived annual growth rate was used in estimating population projections for the planning year 2016 and the planning period from 2017-2026. Derived total annual population growth rate is 1.53%. The following tables show population projections.
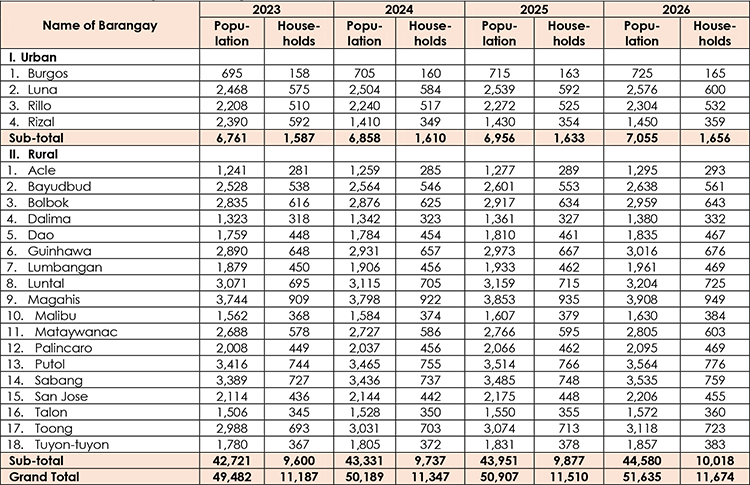
Projected Total Population and Households, 2017-2026
Projected Population and No. of Households By Barangay, 2017-2026
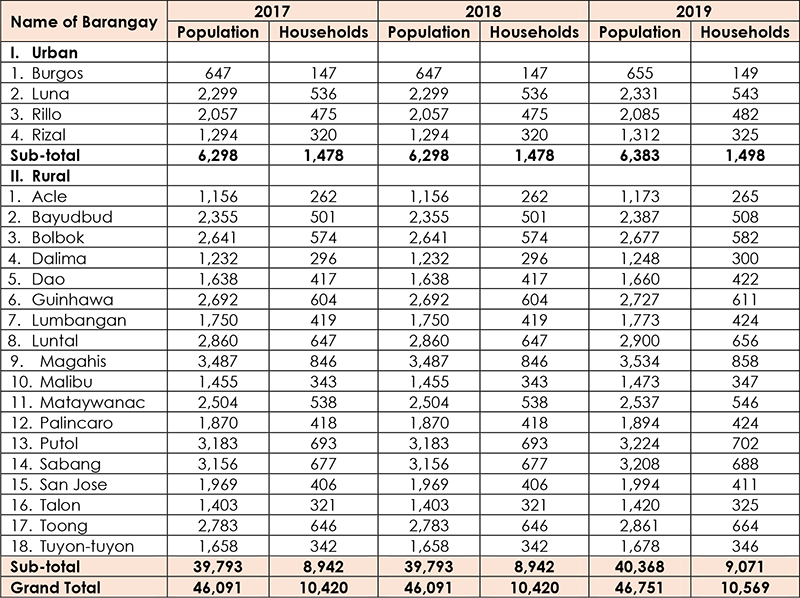
Projected Population and Households By Barangay, 2017-2026
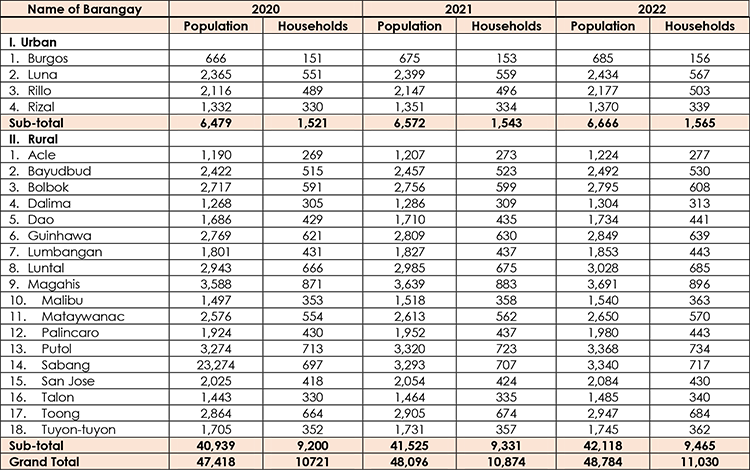
Projected Population and No. of Households, 2017-2026
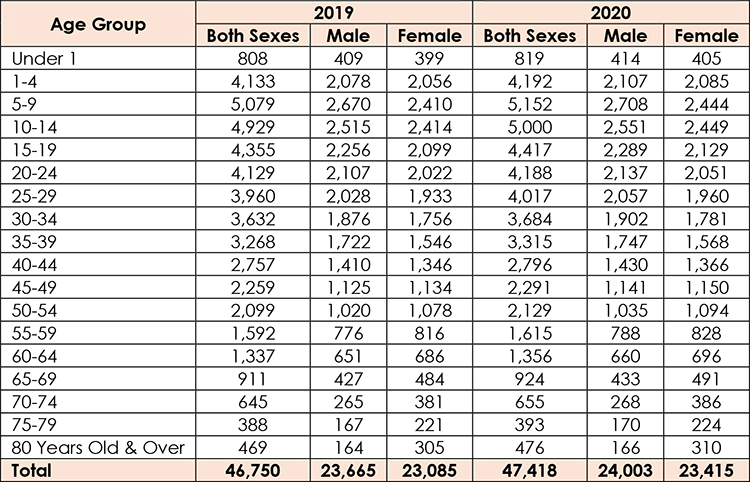
Projected Population By Age Group, By Sex, 2017-2026
Projected Population By Age Group By Sex, 2017-2026
Projected Population By Age Group, By Sex, 2017-2026
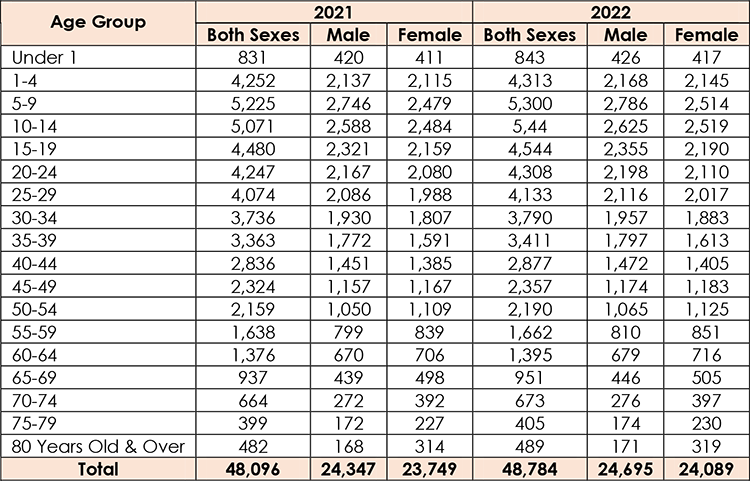
Projected Population By Age Group, By Sex, 2017-2026